AI TOOL PROFILE
KloudMate Review: Observability and SRE-Ops Software

- Data and Analytics
- Application Performance Monitoring
- SREs
- DevOps teams
- Software engineers
- Companies using microservices
- Cloud-native environments
Pricing
KloudMate offers a free signup option. Pricing for paid tiers was not clearly available from the provided evidence. Buyers should confirm current pricing on the vendor website.
At a glance
- Best for
- SREs, DevOps teams, Software engineers, Companies using microservices, Cloud-native environments
- Key use cases
- Microservices Monitoring, Log Analysis and Filtering, Infrastructure Health Tracking, Incident Triage
- Integrations
- AWS integration, OpenTelemetry, Prometheus, vCenter, Slack
- Official website
- Visit kloudmate official website
How AI is used
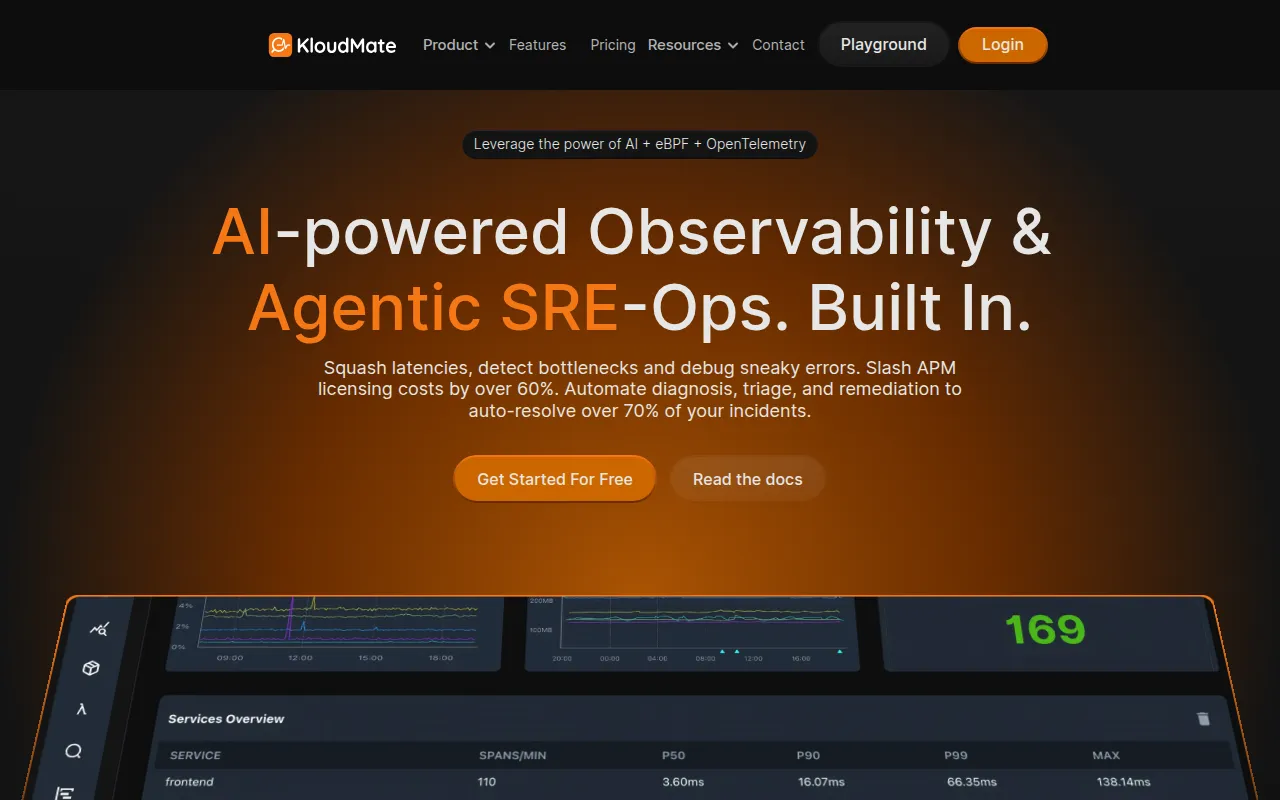
KloudMate is an observability and SRE-Ops platform designed for microservices-based distributed applications. It combines application performance monitoring (APM), log management, and trace analysis to help technical teams identify and debug errors within cloud ecosystems.
The tool is built for SREs, software engineers, and DevOps teams. It leverages eBPF and OpenTelemetry to collect data, supporting infrastructure visibility across Kubernetes, databases, and network performance.
The platform includes features for incident management and AI-powered anomaly detection, which may assist in diagnosing and remediating system issues.
Buyers should confirm if their technical stack is compatible with OpenTelemetry or if they prefer using the provided KloudMate agents for data collection.
Key Features
Holistic Observability
Combines logs, metrics, and traces in one platform to provide a consolidated view of application health.
AI-Powered Anomaly Detection
Uses AI to identify irregular patterns in logs and metrics that may indicate system issues.
Log Management
Provides tools for log filtering, exploration, and analysis across server and container environments.
Kubernetes and Infrastructure Monitoring
Supports monitoring for GKE Autopilot clusters, Linux VMs, and container environments.
Database Monitoring
Tracks performance for database types including MongoDB, Redis, PostgreSQL, MySQL, MSSQL, and OracleDB.
Incident Management
Includes tools for managing the incident lifecycle and escalation policies.
Use Cases
Microservices Monitoring
Tracking requests and performance across distributed microservices to identify latency.
Log Analysis and Filtering
Searching and analyzing logs from AWS CloudWatch, ECS containers, or Node.js applications.
Infrastructure Health Tracking
Monitoring server metrics and network performance to support system availability.
Incident Triage
Using telemetry data to help diagnose and resolve application problems.
Integrations
- AWS integration
- OpenTelemetry
- Prometheus
- vCenter
- Slack
- Azure Monitoring
FAQ
Who is KloudMate designed for?
- It is designed for SREs, software engineers, and DevOps teams, particularly those managing microservices-based distributed applications.
Does KloudMate support a free version?
- Yes, the platform offers a free signup option.
What standards does KloudMate use for data collection?
- KloudMate leverages OpenTelemetry and eBPF for monitoring and data collection.
Source category: Data & Analytics
Source subcategory: Application Performance Monitoring
More tools in Data & Analytics
Other published listings in the Data & Analytics category.
More tools in the Application Performance Monitoring software type
Related listings that share the same software type for comparison and shortlisting.
Browse all Application Performance Monitoring software type tools