AI TOOL PROFILE
KeyLines: Data Visualization SDK for JavaScript

- Data and Analytics
- Data Visualization
- Software Companies
- Enterprise Data Teams
- Cybersecurity Firms
- Fraud Investigation Units
- Intelligence Organizations
Pricing
Pricing is based on a per-application license. A free 21-day trial is available, with additional tiers for Proof of Concept and full Subscription deployment.
At a glance
- Best for
- Software Companies, Enterprise Data Teams, Cybersecurity Firms, Fraud Investigation Units, Intelligence Organizations
- Key use cases
- Cybersecurity Analysis, Financial Crime and Fraud Detection, Law Enforcement Intelligence, Supply Chain Visualization, Knowledge Graph Exploration
- Integrations
- Neo4j, Amazon Neptune, Azure Cosmos DB, Elasticsearch, GraphQL APIs
- Official website
- Visit keylines official website
How AI is used
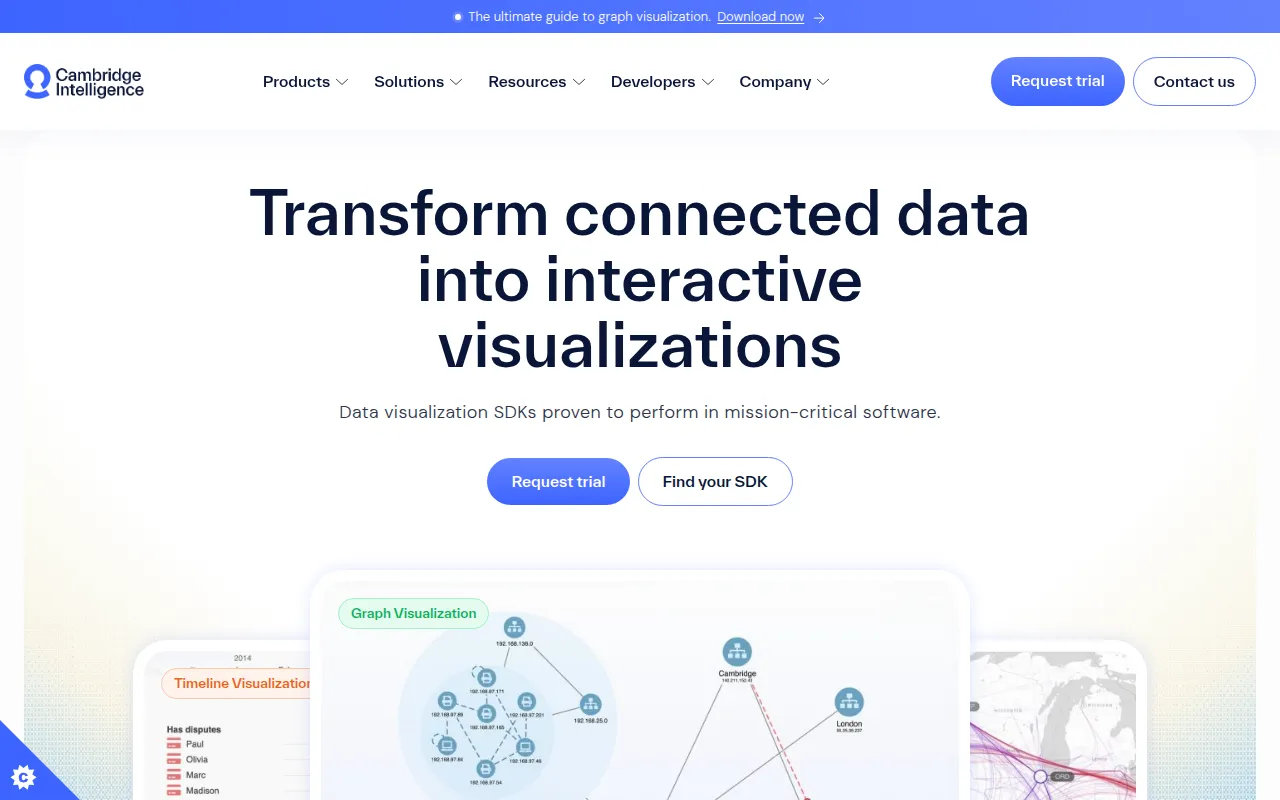
KeyLines is a set of software development kits (SDKs) from Cambridge Intelligence designed to help developers create interactive visualizations of complex, connected data. It is a toolkit that developers integrate into their own software to provide graph, timeline, and map views.
It is built for software companies, enterprise data teams, and security organizations. The toolkits are designed to handle large-scale datasets and are database-agnostic, which means they may be paired with various backends to surface patterns and relationships.
The platform provides specific SDKs for different needs: KeyLines for JavaScript graphs, ReGraph for React environments, KronoGraph for timelines, and MapWeave for geospatial data. This helps teams select the tool that fits their technical stack and user workflow.
Buyers should confirm their internal development capacity, as this is a developer tool requiring integration. They should also review the different licensing tiers, as the free trial and proof-of-concept versions restrict the distribution of the final application to users.
Key Features
JavaScript Graph Visualization
The core KeyLines SDK for creating interactive network graphs with JavaScript.
React Graph Visualization
ReGraph provides a graph visualization toolkit for developers using the React framework.
Timeline Visualization
KronoGraph is designed for building scalable timeline views of data.
Geospatial Visualization
MapWeave allows for the visualization of connected data on a geospatial map.
GPU-based Rendering
Uses GPU acceleration to support panning, zooming, and layouts when handling large datasets.
Figma Design Kit
Supports prototyping graph and timeline interfaces before the development phase begins.
Use Cases
Cybersecurity Analysis
Supports the detection of patterns and anomalies within complex threat landscapes.
Financial Crime and Fraud Detection
Visualizing connections between people, places, and transactions to support compliance and fraud investigation.
Law Enforcement Intelligence
Helping agencies spot links between suspects, victims, and locations.
Supply Chain Visualization
Providing visibility into supply networks to help identify vulnerabilities.
Knowledge Graph Exploration
Making large-scale knowledge graphs interactive for data discovery.
Integrations
- Neo4j
- Amazon Neptune
- Azure Cosmos DB
- Elasticsearch
- GraphQL APIs
- ArangoDB
- Memgraph
- Stardog
- JanusGraph
- TigerGraph
- OrientDB
- Titan
FAQ
What is KeyLines and who is it for?
- KeyLines is a JavaScript SDK used by developers to build interactive graph visualization applications. It is designed for software companies and data teams in fields like cybersecurity and fraud detection.
Does KeyLines work with any database?
- Yes, it is backend-agnostic. It is commonly used with Neo4j, Amazon Neptune, Azure Cosmos DB, and Elasticsearch, and can work with other datastores including CSV files.
Is there a free trial available?
- Yes, a free 21-day trial is available for users to explore the SDK in their own environment.
Source category: Data & Analytics
Source subcategory: Data Visualization
More tools in Data & Analytics
Other published listings in the Data & Analytics category.
More tools in the Data Visualization software type
Related listings that share the same software type for comparison and shortlisting.