AI TOOL PROFILE
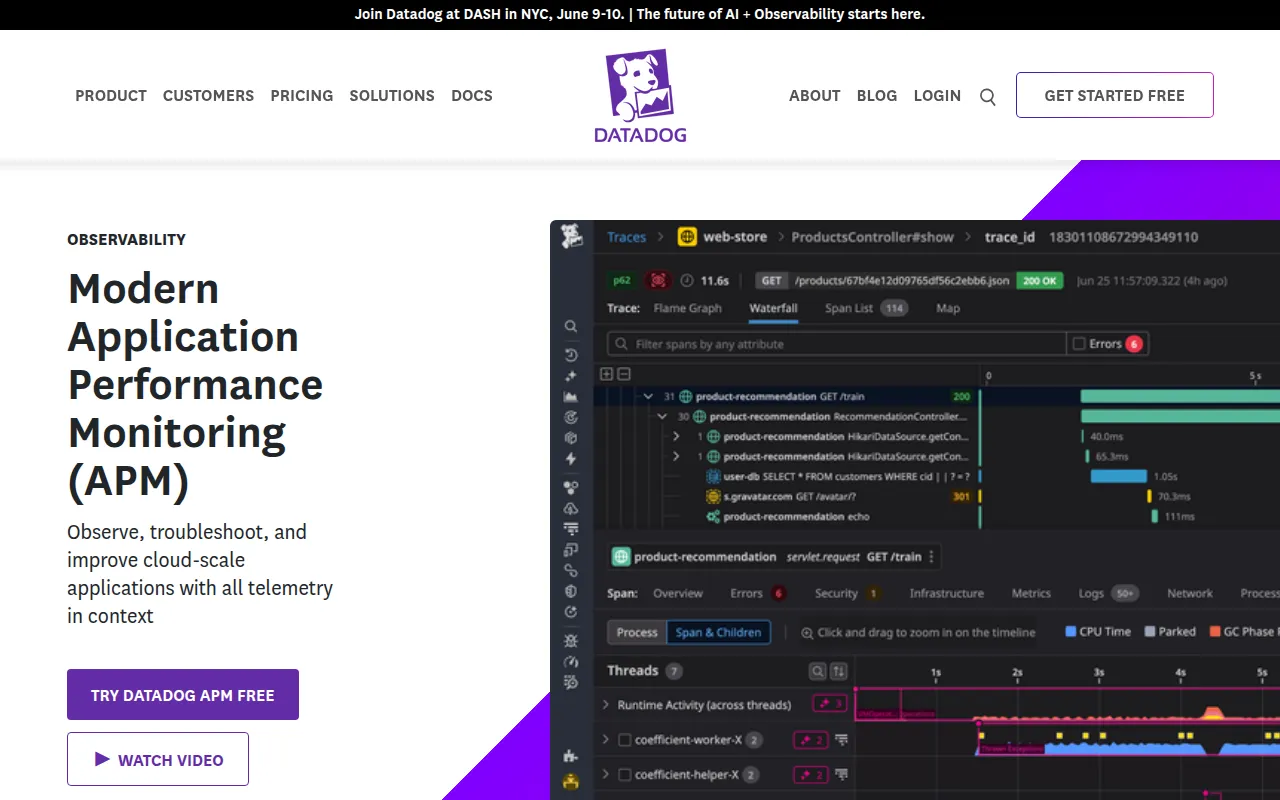
Application Performance Monitoring (APM) | Datadog

- Software Development
- Application Performance Monitoring
- Software Companies
- Enterprise Companies
- Mid-Market Companies
- DevOps Teams
- Site Reliability Engineers
Pricing
Pricing starts at $31 per host per month (billed annually) when paired with Infrastructure Monitoring. Standalone options are available starting at $36 per host.
At a glance
- Best for
- Software Companies, Enterprise Companies, Mid-Market Companies, DevOps Teams, Site Reliability Engineers
- Key use cases
- Root Cause Analysis, Deployment Monitoring, Serverless Performance Tracking, Resource Optimization
- Integrations
- OpenTelemetry, AWS Lambda, Azure App Service, GitHub, Slack
- Official website
- Visit Datadog APM official website
How AI is used
Datadog APM is an observability tool for software development and operations teams. It provides distributed tracing across the full stack, from frontend browser and mobile applications to backend services and databases.
The platform supports environments that need to track service dependencies and monitor health metrics. It includes automated root cause analysis via Watchdog AI and supports various deployment environments, including serverless functions on AWS and Azure.
Buyers should confirm how the host-based pricing and span ingestion limits align with their data volumes. Buyers should also confirm if the required Infrastructure Monitoring subscription is in place, as some APM tiers depend on it.
Key Features
Thread-level Distributed Tracing
Tracks requests across services to help identify the specific source of performance issues.
Watchdog AI
Provides automated root cause analysis and machine learning-based alerts to help detect anomalies.
Universal Service Monitoring
Automatically discovers, maps, and catalogs services and dependencies without requiring code changes.
Continuous Profiler
Analyzes code-level performance in production, including CPU and memory consumption.
Change Tracking
Correlates performance shifts with code deployments, feature flag changes, and configuration updates.
OpenTelemetry Support
Supports native and hybrid OpenTelemetry setups for data ingestion.
Use Cases
Root Cause Analysis
Using distributed tracing and Watchdog AI to identify the source of application errors or latency.
Deployment Monitoring
Comparing performance metrics across different versions before, during, and after a release to detect breaking changes.
Serverless Performance Tracking
Monitoring and tracing functions in AWS Lambda or Azure App Service to find bottlenecks.
Resource Optimization
Using the Continuous Profiler to identify resource-consuming methods for tuning.
Integrations
- OpenTelemetry
- AWS Lambda
- Azure App Service
- GitHub
- Slack
- Jira
- ServiceNow
FAQ
What is a billable APM host in Datadog?
- A billable APM host is a host actively generating traces that are submitted to the Datadog SaaS application, such as an OpenTelemetry Collector.
Does Datadog APM require Infrastructure Monitoring?
- It can be purchased as a standalone product, but certain pricing models require an accompanying Infrastructure Monitoring subscription for every APM host.
What languages does Datadog APM support?
- It supports Java, Python, Ruby, Go, Node, .NET, and PHP.
Is there a free trial for Datadog APM?
- Yes, Datadog offers a 14-day free trial of its product suite.
Source category: Software Development
Source subcategory: Application Performance Monitoring
More tools in Software Development
Other published listings in the Software Development category.
More tools in the Application Performance Monitoring software type
Related listings that share the same software type for comparison and shortlisting.
Browse all Application Performance Monitoring software type tools